Lesson 4: The Four Rs - Part 2
Attention
Many people have this view of our 4th R in relation to Social Sciences...but Statistics, where much of the Arithmetic of the Social Sciences reside, is critically important. It is important for you to understand when it is useful and the LIMITS to how useful it is.
Learning Outcomes
Upon completion of this lesson's material, students will be able to:
- Relate the necessity to describe human behavior in terms of probability.
- Describe various measures of "Central Tendency"
- Distinguish between "Causation and Correlation"
Teaching
The Challenge of Human Behavior
The field of Psychology can be defined as the "Systematic scientific study of human and animal behavior."
The Goals of Psychology are to ______________ human behavior.
- Describe
- Explain
- Predict
- Control
The challenge with each of these goals is that MOST of human behavior is fairly complex and difficult to describe...let alone explain, predict, or control. Even some of the most simple behaviors that seem straight forward.
For example: Someone might say this: "The more you study the higher your grades are going to be."
While this may be true, the reality of what predicts grades is much more complex. This notion is described by Complexity or Complex Systems Theory and validates that "multiple factors" contribute to human behavior all the time. In this example, here is a list of the OTHER factors that would need to be taken into consideration if we were to develop a model to explain the relationship between studying and higher grades:
- What do you mean by "study"?
- By "more" do you mean more time, more reading, more often in the week?
- Is there a "diminishing returns" factor...meaning can you study TOO MUCH?
- What strategies are being used to study?
- Do the strategies match the type of content and the kind of assessments that are going to be used?
- What is the intelligence (raw academic ability) of the students?
- What are the consequences of failure?
- How are students motivated to achieve high grades?
- Does the level of effort to achieve high grades match the degree of reward for high grades?
- Is there a connection between the material and practical needs for the student?
- How was the information taught?
- What language is the material in?
- What history of studying do the students have?
- How do students perceive their own ability to be successful?
- Do the students eat, sleep, exercise in positive ways?
- Do the students engage in recreational drug use while studying?
- What kinds of environments does the studying happen in?
As you can see, there are many, many factors that may play into a full understanding of something as simple as the time we spend studying.
Counter to the Complexity theory there is the tendency for humans to interpret data in the simplest possible way. This is called Parsimony. In scientific circles this is known as Occam's razor.
"The principle states that among competing hypotheses that predict equally well, the one with the fewest assumptions should be selected. Other, more complicated solutions may ultimately prove to provide better predictions, but—in the absence of differences in predictive ability—the fewer assumptions that are made, the better."
As you can see, the dichotomy of Complexity and Parsimony make for a challenge in describing human behavior. This is where statistics comes in. Statistics allow us to use numbers to represent complex relationships in simple, understandable ways.
An Example:
I'll start with the example of studying and good grades. Let's say that we were going to focus on a number of the different variables associated with studying and measure each one's relationship with good grades (measured as a numerical grade form 0-100).
We would then take 100s of students and divide them into different groups...some would study an hour per week, others would study 2 hours a week, and so on...
We would then gather data on grades and the other variables associated with studying and do some statistics.
Central Tendency
Central Tendency statistics allows us to identify different ways of describing the behavior of each group. The most common one is "AVERAGE"...we could average the grades in each group (not everyone would get the SAME exact grade, so we could average them to get ONE number to describe all of the group members) and compare them to the AVERAGE in other groups. This is a very common statistical test.
Other measures of central tendency include MEDIAN and MODE and RANGE.
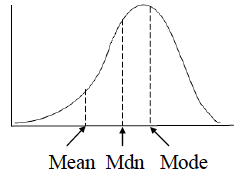
These tell us something about the way the group is but they can be misleading.
Click HERE to watch a cool video on Central Tendency!
Correlation and Causation
Let's now say that our data supports that groups with a higher AVERAGE number of hours of studying usually scored higher in GRADES.
We can use statistics to describe this relationship between the number of hours of studying and grades...it is called a correlation. However, because there are so many factors that relate to grades we can ever really be SURE that it is because of STUDYING that we get good grades.
In Social Sciences we can never really talk about factors that CAUSE human behavior because there are always so many factors involved and so much diversity in groups. We can however, calculate CORRELATIONS...this is a number that represents the strength and type of relationship between two variables.
Here is a video that describes the difference between correlation and causation.
Probability
From work like this the best we can do is come up with MODELS and THEORIES that describe the relationships between variables. Based on these models and theories we can PREDICT, to some accuracy what might happen. So, based on our data we may say to someone:
"Based on the data we collected regarding the relationship between studying and good grades we can predict that it is PROBABLY likely that you will get better grades if you study more."
That is about as far as statistics and research will take us in terms of human behavior.
Assessment
Lesson 4 Quiz
Be sure to complete the Lesson Quiz.
Lesson 4 Discussion
In this discussion post instances of human behavior that you believe are based on multiple factors (as described in the Lesson). What sorts of data would you need to gather in order to construct a MODEL or a THEORY that explains the behavior? How does the COMPLEXITY of human behavior limit the use of statistics to describe it?