Quantitative Literacy (ELO Quantitative Reasoning) - Calculating a Correlation

Learning Outcomes
This assignment is designed to address Quantitative Literacy learning outcomes. These specific outcomes are incorporated into the grading rubrics for the papers.
If you wish, you may click HERE to download the American Association of Colleges and Universities VALUE rubric on Quantitative Literacy
Basic Correlation Information
Yes, this activity is all about MATH!
In psychology ask a lot of questions about CAUSE and EFFECT...for example:
"Does studying more increase final grades?"
While this seems to be intuitively true we are not really sure if more studying CAUSES increased final grades or if more studying is CORRELATED with increased final grades. It might be that SMART people (who get higher grades all the time) tend to study more because they enjoy reading and studying...but the REAL reason they got good grades is because they are SMART!
A CORRELATION is a mathematical relationship between two variables, but it DOES NOT imply a Cause-Effect relationship.
Here is a video from Khan Academy provising a great example of the difference between a correlation and the assumptions of causation.
Correlations are expressed as numbers that represent the DEGREE and DIRECTION of a relationship between two variables.
The STRENGTH of the relationship is a measure of the degree of the relationship...meaning if one value goes up, to what degree does the other one go up.
Example: "height" and "shoe size" tend to have a strong relationship...the taller someone is, the more likely their shoe size is larger.
The DIRECTION of the relationship is either positive or negative. Positive Correlations mean that when one variable goes up the other one goes up...Negative Correlations signify that when one variable goes up the other one goes down.
Example of a Positive Correlation: "number of hours you study" is positively correlated with "grades"...as one goes up the other goes up.
In this case, when you compute a correlation---as you will see below---the correlation number will be positive indicating a positive correlation.
Example of Negative Correlation: "number of hours watching TV" is negatively correlated with "grades"...as one goes up the other goes down.
In this case, when you compute a correlation---as you will see below---the correlation number will be negative indicating a negative correlation.
Here is a brief video on the various kinds of correlations we can find.
How a scientist conducts a Correlation Study
THIS IS AN EXAMPLE OF WHAT I'M GOING TO HAVE YOU DO FOR THIS ASSIGNMENT
(Click HERE to view this example of a correlation that was computed to find the relationship between "height" and "self-esteem")
This example shows how to do some MATH in order to calculate a CORRELATION (or relationship) between two variables and then you will use this information to draw CONCLUSIONS as to the relationship between the two variables. Our two variables are:
HEIGHT and SELF-ESTEEM
Hypothesis
A hypothesis is an educated guess as to what the researcher THINKS the relationship is going to be before the study starts. They are usually written in pairs. One that says that there IS a relationship and one that says that there IS NOT a relationship. We would base our guess on what we know about the variables already and any previous research.
The "Null Hypothesis" is that there is NO RELATIONSHIP
The "Alternative Hypothesis" is that there IS A RELATIONSHIP
So, for this study, the hypotheses would be written like this:
H(null): There is no relationship between height and self-esteem.
H(alternative): There is a relationship between height and self-esteem.
Gathering Data
The researcher then needs to go out and gather data...in this case, the researcher would need to pick people and measure their height and their self-esteem. (In the chart in the above website you can see the data that was collected).
Creating a Table of Calculations
Once researchers have their data, they need to do some calculations to get the numbers that they need to complete the correlation calculation.
Here is an example of the kind of table they put together:
Subject |
Variable X |
X squared |
Variable Y |
Y squared |
X times Y |
1 |
|||||
2 |
|||||
3 |
|||||
4 |
|||||
5 |
|||||
6 |
|||||
7 |
|||||
8 |
|||||
SUM |
SUM of X |
SUM |
SUM |
SUM |
SUM |
- In the Variable X column you write the scores for your first variable..."height" in the example
- In the X squared column you square each of the X values
- In the Variable Y column you write the scores for your second variable..."self-esteem" in the example
- In the Y squared column you square each of the Y values
- In the X times Y column you multiply each X value by the Y value
- In the SUM spots you add all the values of each column
The symbol that looks sort of like the letter "E" is called Sigma, and it stands for "SUM"...so you can see where each of the sums in the graph above fits into the formula below
![]()
Calculating the Correlation
Near the middle of this website you can see the formula for calculating the correlation...it looks complicated but it is really not that hard if you just take it step by step.
Here is what it looks like:
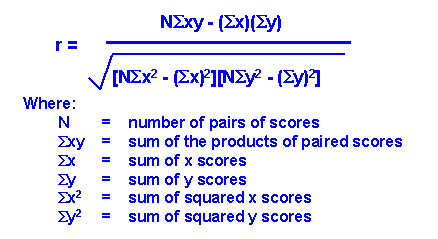
This formula produces a value for "r" which is the correlation factor.
- A positive number means a positive correlation (this means that when one factor increases, so does the other)
- A negative number means a negative correlation (this means that when one factor increases, the other decreases)
- Correlations range from -1 to +1.
- An answer of +1 is a perfect positive correlation, an answer of a -1 is a perfect negative correlation, a ZERO is absolutely no correlation
- The STRENGTH of a correlation (positive or negative) is how close the r value is to +1 or -1
With this number researchers decide if the NULL or the ALTERNATIVE hypothesis is correct!
Review the example on the website and familiarize yourself with this process. In this assignment we are not going to do everything exactly like the website but close!
YOU ARE NOW GOING TO DO A STUDY!
(or at least you are going to do the math part of a study)
OK...for this activity you are going to learn to do some MATH in order to calculate a CORRELATION (or relationship) between two variables and then you will use this information to draw CONCLUSIONS as to the relationship between the two variables.
HEIGHT and RUNNING SPEED
Height will be measured in inches and Running Speed (measured in time, or seconds) reflects data on a 40-yard-dash
I'm going to give you some data and you are going to go through the same steps that are outlined in the website above...don't worry, I will explain them below as well!
READY!
Step 1: State the Hypotheses
Come up with statements for both the NULL and ALTERNATIVE hypotheses for the relationship between "height" and "running speed".
- Null Hypothesis is...
- Alternative Hypothesis is...
Step 2: Create your Data Table
For this exercise you are provided with the data on "height" and "running speed" for eight people...your job is to complete the table!
Subject |
Variable X |
X squared |
Variable Y (seconds) |
Y squared |
X times Y |
A |
60 |
fill this in |
8 |
fill this in |
fill this in |
B |
55 |
fill this in |
11 |
fill this in |
fill this in |
C |
56 |
fill this in |
10 |
fill this in |
fill this in |
D |
52 |
fill this in |
12 |
fill this in |
fill this in |
E |
48 |
fill this in |
14 |
fill this in |
fill this in |
F |
44 |
fill this in |
16 |
fill this in |
fill this in |
G |
47 |
fill this in |
13 |
fill this in |
fill this in |
H |
52 |
fill this in |
12 |
fill this in |
fill this in |
N = 8 |
calculate the SUM |
calculate the SUM |
calculate the SUM |
calculate the SUM |
calculate the SUM |
You will need to create a table similar to this in your document so you can submit it as part of your assignment.
Step 3: Calculate the Correlation
There is not much more to say about this particular step...complete the calculation and solve for "r"
Step 4: Write up your Results
Now you want to prepare your document to submit for this assignment. Your paper must include the following:
- Title Page
- A description of your Null and Alternative hypotheses
- A copy of your Data Table completed with sums
- Answers the following questions:
- What is the correlation coefficient that you calculated (r)?
- What decision should be made about the hypotheses? Which one is right?
- In narrative form, state your conclusions about the relationship between the variables (height and running speed). Indicate the DIRECTION and STENGTH of the relationship
- Does being taller cause one to run faster? If not, what other factor might account for the relationship?
The document should be formatted and crafted to meet the criteria set forth in this rubric.
| Title Page | 10 pts |
| Null and Alternative Hypotheses | 10 pts |
| Complete Data Table | 20 pts |
| Accurate calculation of correlation coefficient | 20 pts |
| Logical decision on hypotheses | 20 pts |
| Narratives on relationship and conclusions | 20 pts |
| Total Points | 100 pts |